
First view of Elastic Stack

Intro to Observability
Observability is not a technology that a vendor delivers in a box, but it is an attribute of a system you build, like usability, high availability, and stability.
Observability is more than just detecting undesirable behaviors, and it is also about providing operators with granular information to debug production issues quickly and efficiently.
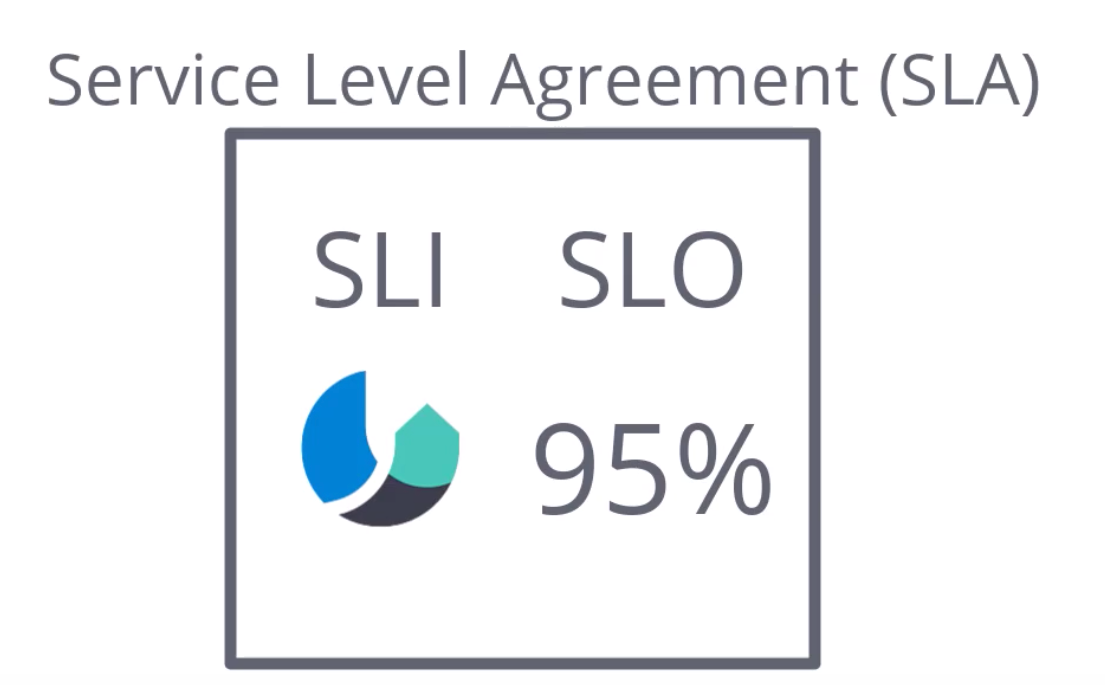
Observability makes possibile to promise a service level agreement (SLA) to clients based on SLO (service level objective) and SLI (service level indicator).
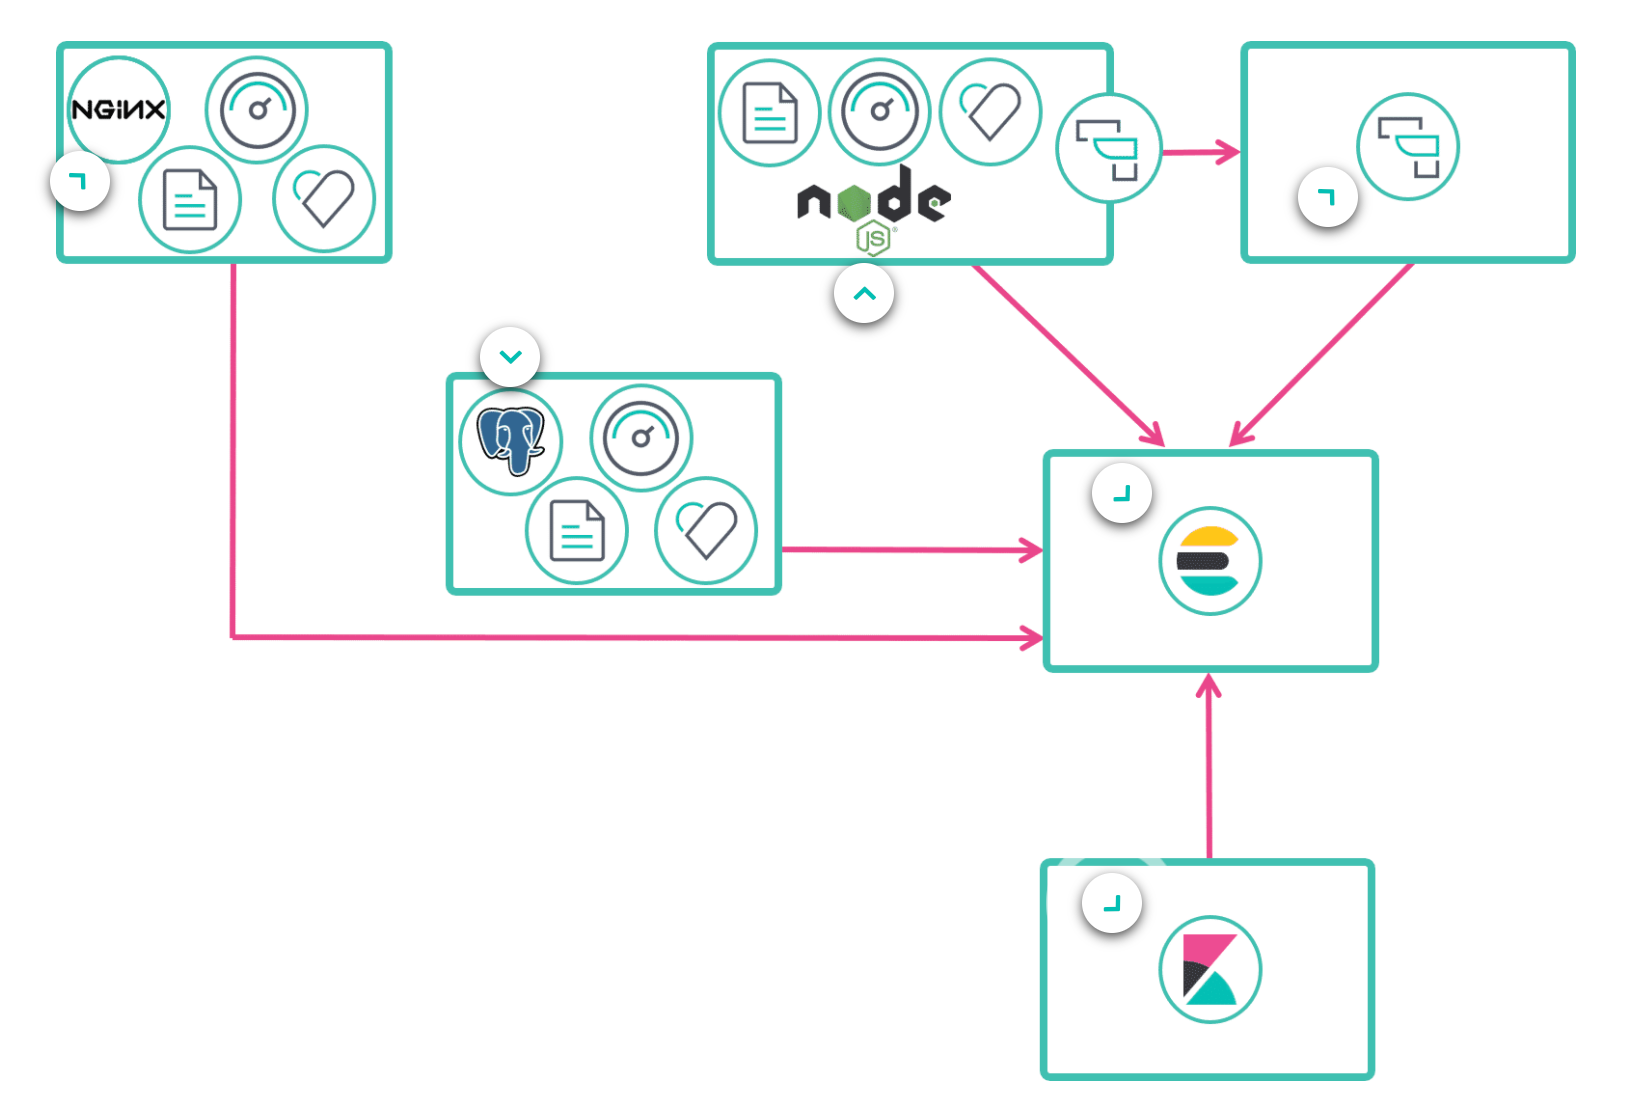
Observability Data Flow
As an high view we can imagine the flow below. Applications like NGINX, Postgres or NodeJs ship their data through Beats to Elastitsearch. Sometimes the middle agent Logstash is used to normilize logs before sending to the elasticsearch engine.
Finally data are rendered in the Kibana dashboard.
Logs
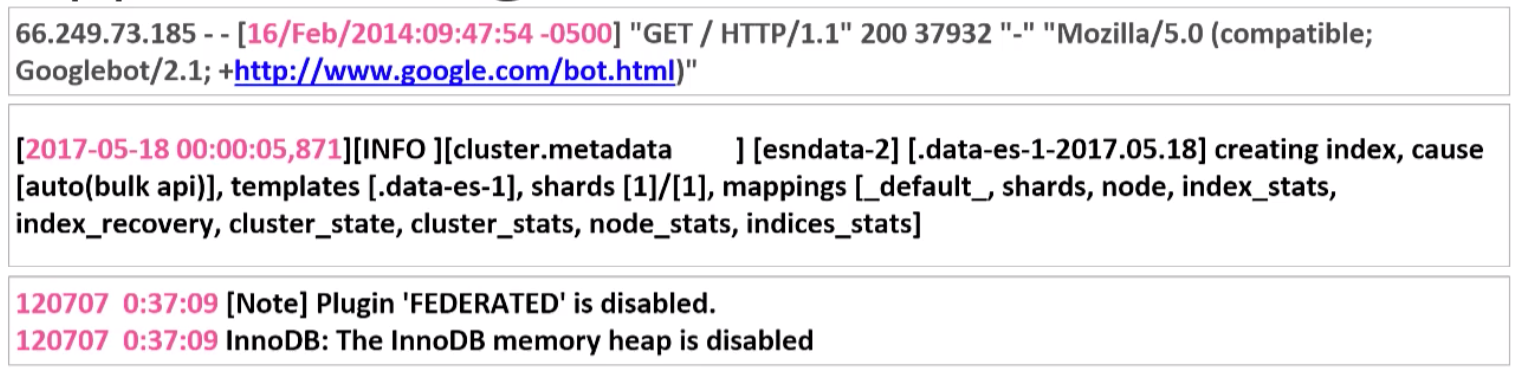
What are the main problems handling logs?
- Consistency: Every application and device logs in its own format;
- Time Formats: There are many different formats but luckily ISO 8601 solves this problem for you by standardizing all date and time formats (https://en.wikipedia.org/wiki/ISO_8601);
- Decentralization: Your logs are spread across all your servers. SSH + grep aren’t scalable;
- Experts Required: You need experts to interpret these log messages since every application is in a different format.
FileBeat
Filebeat is a lightweight shipper for forwarding and centralizing log data. Installed as an agent on your servers, Filebeat monitors the log files or locations that you specify, collects log events, and forwards them either to Elasticsearch or Logstash for indexing.
Filebeat guarantees that events will be delivered to the configured output at least once and with no data loss using harvesters and registry file.
For the detailed implementation of FileBeat i really suggest to read this few lines -> https://www.elastic.co/guide/en/beats/filebeat/current/how-filebeat-works.html#harvester
Indexes
Elasticsearch store received data in indexes.
The easiest explanation of a elastic index is that is like a Database. Every index can have many types. Types contain documents with relative properties.

A very common usage is to assign a new index for each day. Your list of indices may look like this:
- logs-2013-02-22
- logs-2013-02-21
- logs-2013-02-20
Then elastic search permits to query data inside these indexes through dedicated APIs like:
GET /_search { "query": { "query_string" : { "query" : "(new york city) OR (big apple)", "default_field" : "content" } } }Logs lifecycle
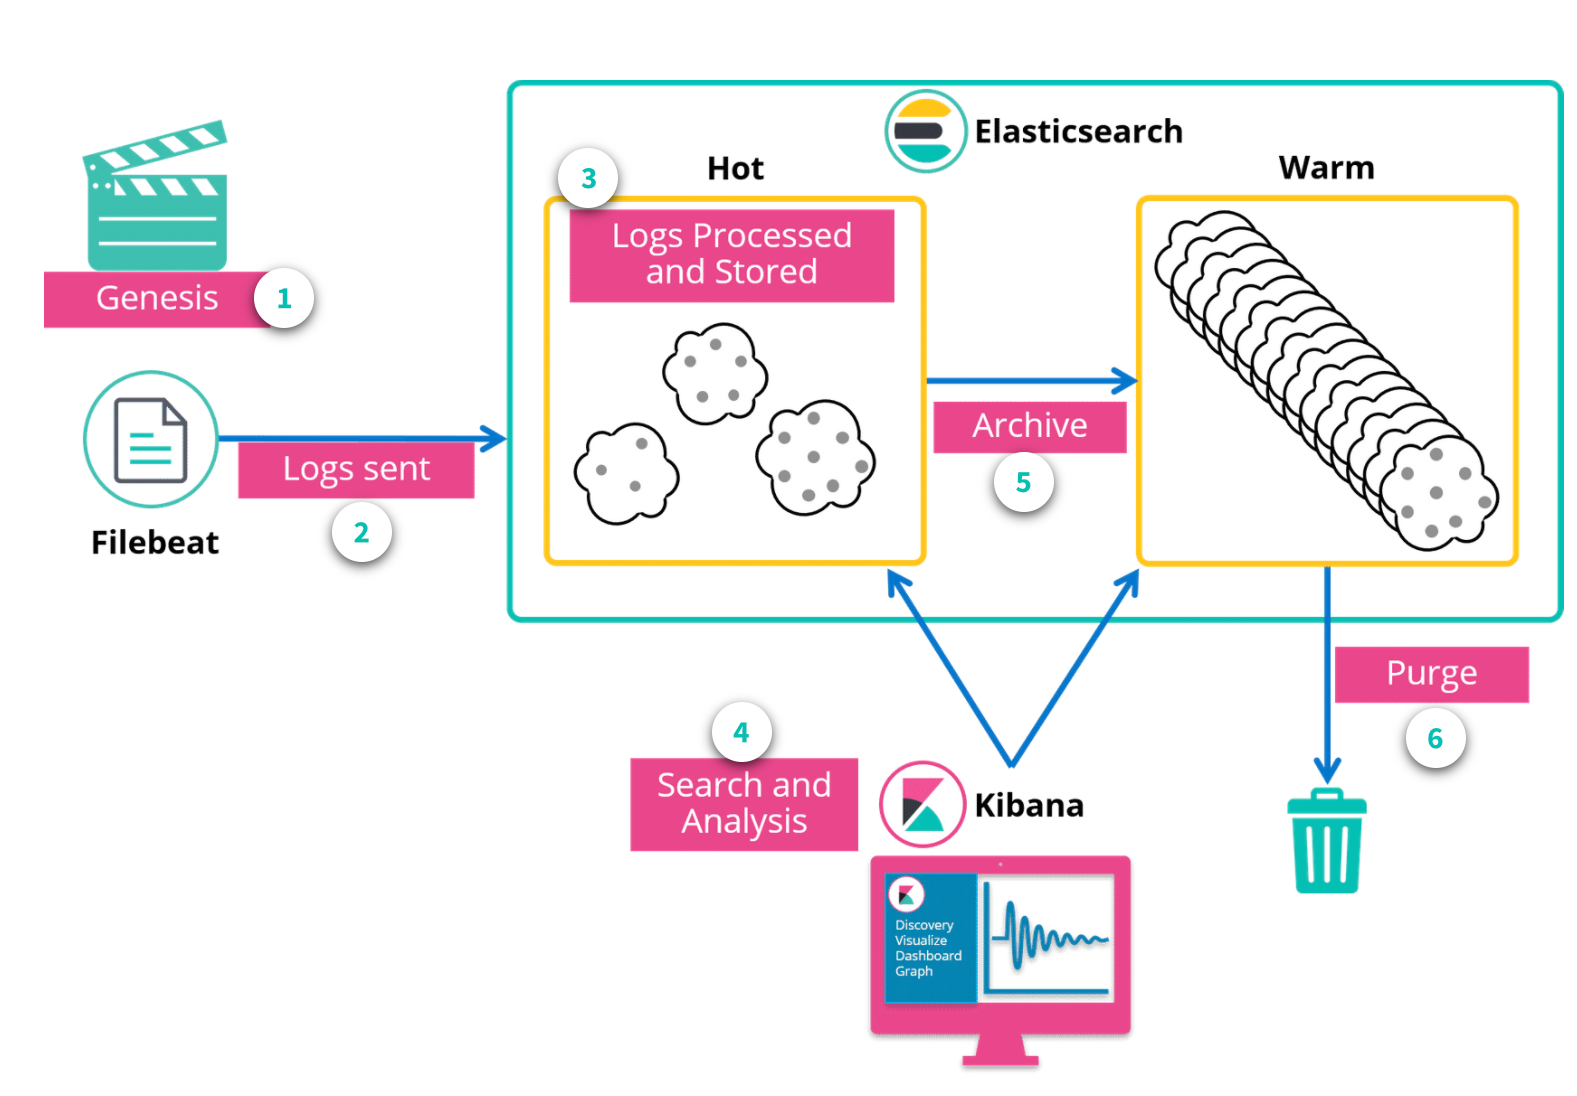
Logs are readed and shipped by Filebeat. Elastisearch updates hot indexes and permit Kibana to query them.
With Index Lifecycle Management feature you can automate the optimization of the indexes. [4]
Hot indices are actively receiving data to index and are frequently serving queries.
Warm indices are no longer having data indexed in them, but they still process queries. They are generally merged and moved to old HDD.
Then Warm indexes can be automatically purged when too old.
Metrics
Both logs and metrics are time series oriented, and they both contain keywords.
Logs are recorded as events occur. The date and time are recorded at the time of the event. Notice that there are multiple events listed. For every single event, there will be a different date and time.
Metrics are a bit different from logs. Metrics are generated based on a schedule. For example, looking at the dates here you can notice that information is being recorded every five minutes.
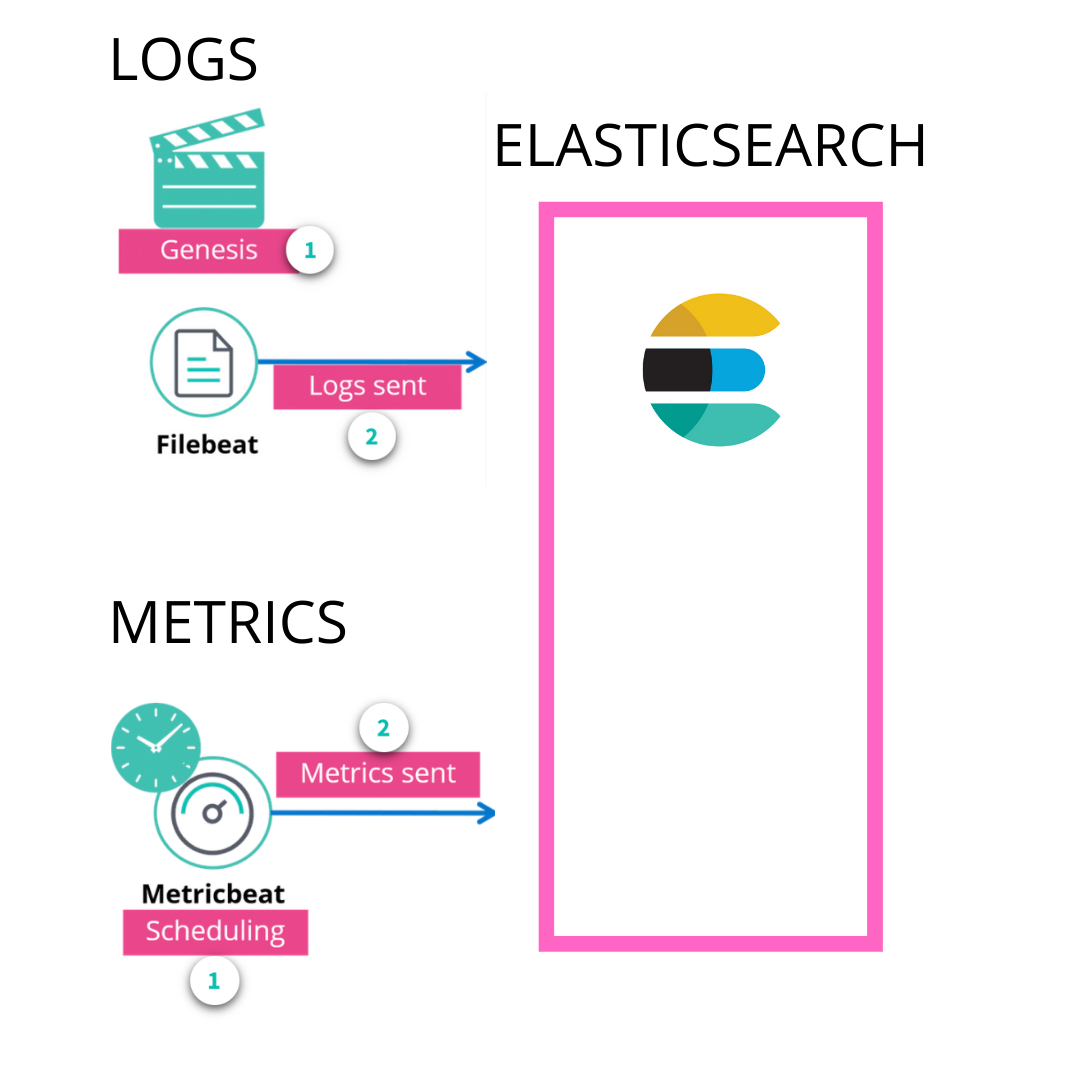
Metrics lifecycle
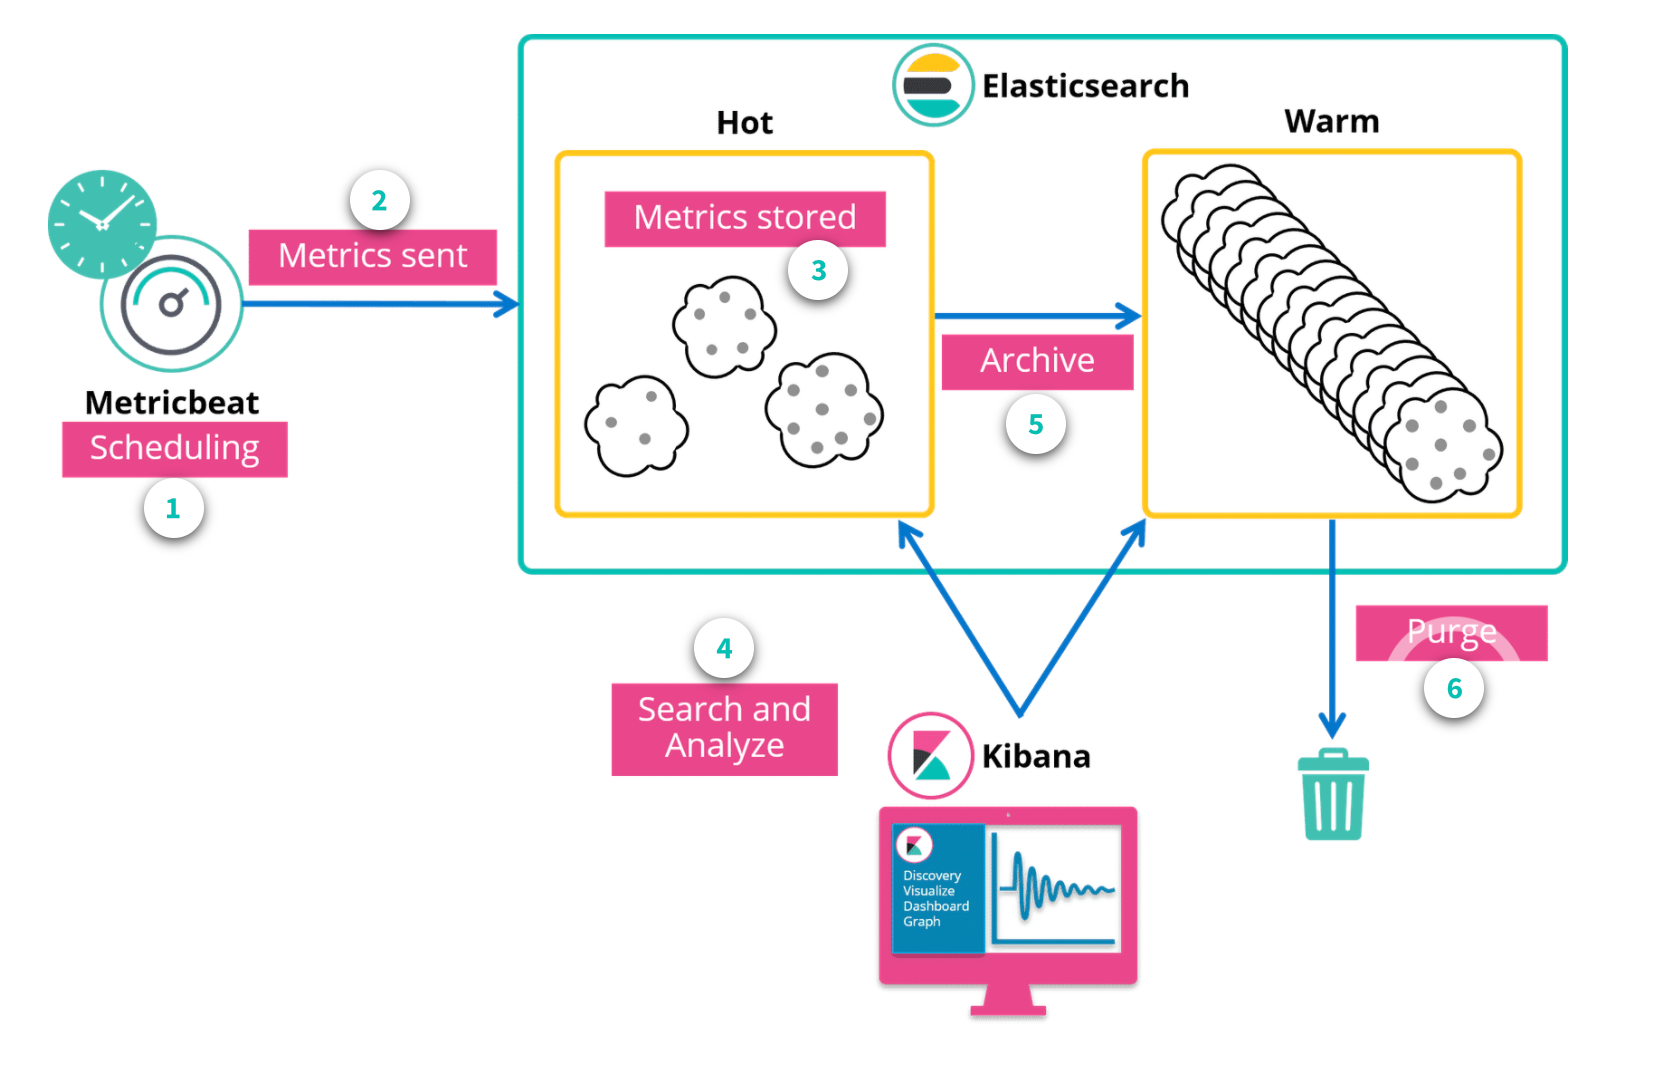
Metrics lifecycle is the same as Logs lifecycle except for the producing. As we said metrics are produced by a scheduler inside the metricbeat in the other hand logs are produced by applications and read by Filebeat.
Beats
Beats are open source data shippers that you install as agents on your servers to send operational data to Elasticsearch. Elastic provides Beats for capturing:
- Auditbeat for audit data
- Filebeat for log files
- Functionbeat for cloud data
- Heartbeat for availability
- Journalbeat for Systemd journals
- Metricbeat for metrics
- Packetbeat for Network traffic
- Winlogbeat for Windows event logs
APM
An other optional component of the Elastic Stack is APM (application performance monitoring). It allows you to monitor software services and applications in real time — collect detailed performance information on response time for incoming requests, database queries, calls to caches, external HTTP requests, and more. The APM give you the ability to see how your applications performs and where they needs some attentions.
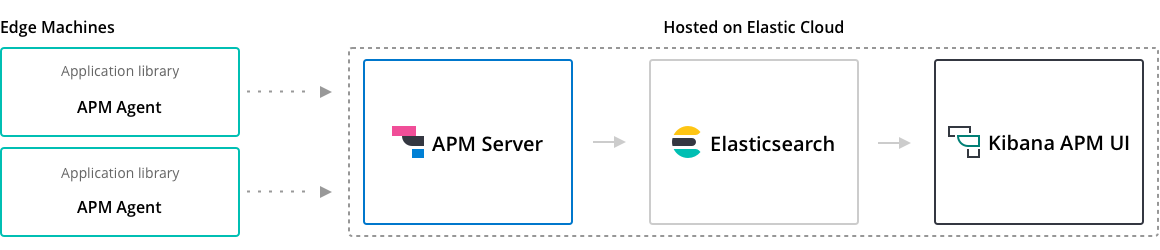
APM flow is composed by:
- APM agent that are language specific libraries
- APM (stateless) server that receives data from applications
- Elasticsearch and Kibana like Logs and Metrics
APM agent
It's very easy to add the APM agent of an existing Java application for example:
java -javaagent:/.../elastic-apm-agent-<version>.jar
-Delastic.apm.service_name=my-application
-Delastic.apm.server_urls=http://localhost:8200
-Delastic.apm.application_packages=org.example
-jar my-application.jar
Instead in a Flask application:
pip install elastic-apm[flask]

# initialize using environment variables
from elasticapm.contrib.flask import ElasticAPM
app = Flask(__name__)
apm = ElasticAPM(app)

# or configure to use ELASTIC_APM in your
# application's settings
#
from elasticapm.contrib.flask import ElasticAPM
app.config['ELASTIC_APM'] = {
  # Set required service name.
  # Allowed characters:
  # a-z, A-Z, 0-9, -, _, and space
  'SERVICE_NAME': '',

  # Use if APM Server requires a token
  'SECRET_TOKEN': '',

  # Set custom APM Server URL (
  # default: http://localhost:8200)
  #
  'SERVER_URL': '',
}
apm = ElasticAPM(app)
APM agents are also available for .NET, Django, NodeJS, Rails, Rack, RUM js and Go.
For the full documentation read here -> https://www.elastic.co/guide/en/apm/get-started/7.7/agents.html
Apm server [5]
The APM Server receives data from APM agents and transforms them into Elasticsearch documents. It does this by exposing an HTTP server endpoint to which agents stream the APM data they collect.
The main APM server features are:
- standardize eterogenous APM agents;
- controls the amount of data flowing into Elasticsearch;
- in cases where Elasticsearch becomes unresponsive, APM Server can buffer data temporarily without adding overhead to the agents.
What kind of data Elastic APM agents collect
APM agents automatically pick up basic host-level metrics, including system and process-level CPU and memory metrics. Agent specific metrics are also available, like JVM metrics in the Java Agent, and Go runtime metrics in the Go Agent.
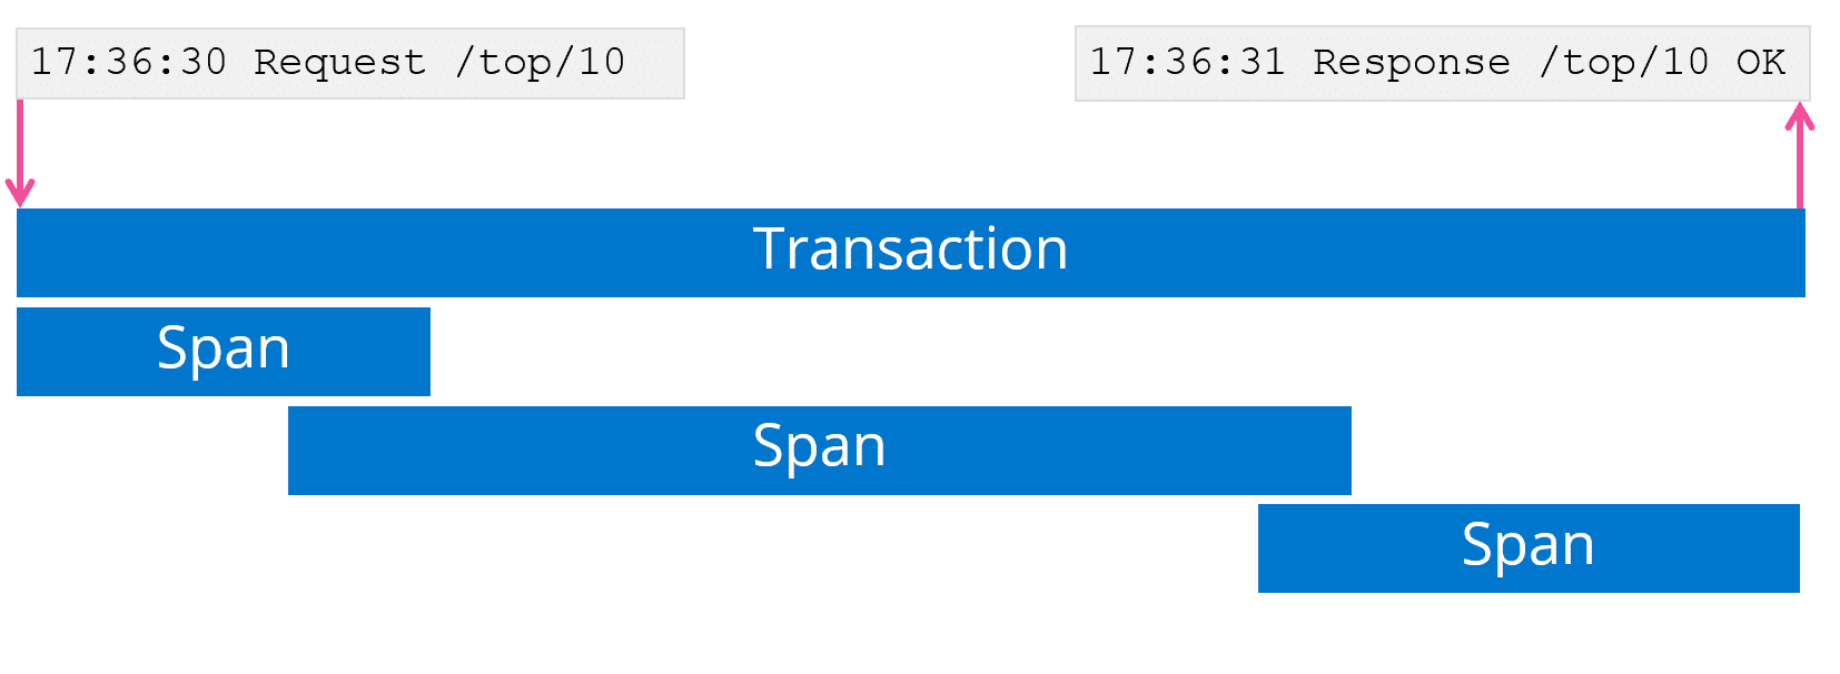
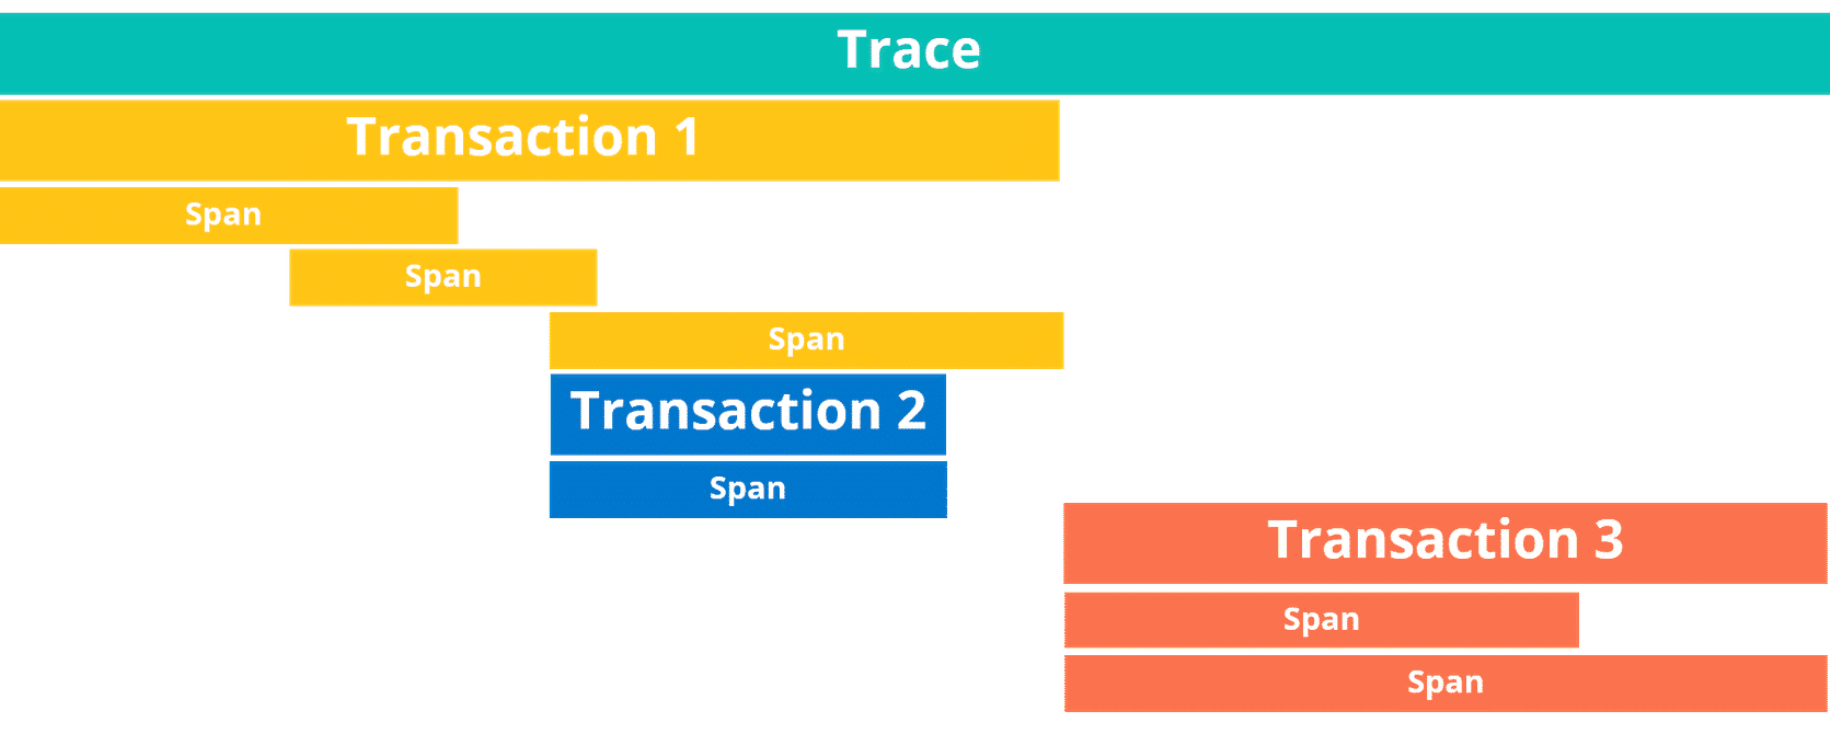
Distributed Tracing
Elastic APM supports distributed tracing merging together Transactions and Spans. Distributed tracing enables you to analyze performance throughout your microservices architecture all in one view.
References
[1] https://www.elastic.co/training/free
[2] https://www.elastic.co/guide/en/beats/filebeat/current/index.html
[3] https://www.elastic.co/blog/what-is-an-elasticsearch-index
[4] https://logz.io/blog/managing-elasticsearch-indices/
[5] https://www.elastic.co/guide/en/apm/server/7.7/overview.html